
CyberTools Features Update V4.3
By Marcie Terman CyberTools COO
First, I want to thank the users that have continued to provide their feedback in an effort to help us improve the functionality of CyberTools. Many of you will see your ideas reflected in the new basket trading setup process. We have also brought a lot of your suggestions into the risk information detail page. You guys have been great and we really appreciate your input. Please keep your ideas coming.
Here is a full list of the changes and updates to be covered in the v4.3.
- New feature – View Only – To monitor multiple exchanges in one place without the use of a particular trade management tool needed.
- New feature – Trade list export function
- Asset list display moved to dashboard (from Accounts area)
- New feature – Asset Risk ratings on dashboard
- New Feature – Risk rating details page
- Upgrade – Easy access to suspend account control from dashboard
- Improvement – More intuitive set up of basket trading. [see Basket Trading Tutorial page]
- Improvement – An easier way to manage assets in RMaaS Risk Management. [see RMaaS Risk Management Tutorial page]
New feature – View Only Exchange Accounts on Dashboard
We’ve had some CyberTools users request the ability to view all their cryptocurrency exchange accounts in one place, even exchange accounts that are not using one of the asset management tools. This way they can monitor all the exchange accounts conveniently at once without the need to log into each account separately.
To add an account without using a tool, select ACCOUNTS from the left handed menu and go through the process of adding the account and creating the API key which is added to the dashboard. If you only want to monitor an account set up the API key to send information about trades, account balances and ledge transactions only. Do not set up the ability to make or cancel trades. Ignore step 3 (STRATEGY) where you select which management tool you want to use and jump to the ‘Dashboard’ page. This will now display the monitoring of your account and if at any time you decide to complete setup a quick link is available directly from the dashboard.
New feature – Trade list export function
| It is now possible to export a trade list directly from an exchange dashboard. The button can be found here. (Exports can be generated a maximum of once every 2 hour per account and will be available to download for up to 24 hours.) |  |
Asset list display moved to dashboard (from Accounts area)
 |
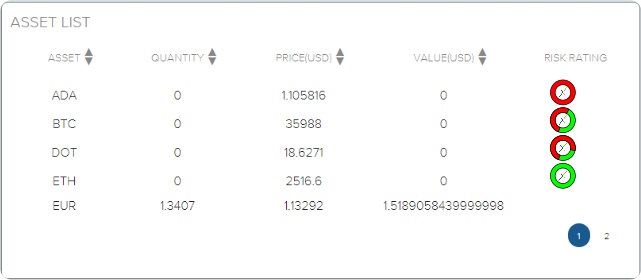
To view the list of assets that were held in a cryptocurrency exchange account it was originally necessary to view if after selecting ACCOUNTS from the left handed menu. Now it is possible to conveniently view all the digital assets held in a cryptocurrency exchange account from the lower left side of the dashboard.. |
New feature – Asset list includes risk rating
Each digital asset that has an effective risk model available has a risk rating icon which indicates the current expected forward volatility for that asset. The rating is 0 to 100 with a risky asset with a high probability of forward volatility noted in red. When the system is confident that forward volatility is extremely low the risk icon will be fully green. In the example below the middle two assets are considered somewhat risky. Clicking on the icon will lead to a detail page with more information about risk indicators for the asset.
Risk Rating detail page
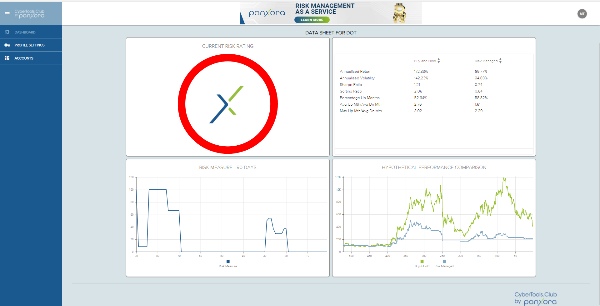
[upper left] The risk ratings ring represents the forward volatility of an asset rated on a scale of 0-green-not risky to 100-red-extremely risky.
Asset Risk Comparison
[upper right] shows the potential performance of Buy & Holding an asset vs the potential performance of Risk Managing that asset using RMaaS.
Confidence Measure Chart
[lower left] This shows the model’s anticipated volatility over the previous 90 days excluding today’s rating which has not been noted yet.
Hypothetical Performance Comparison Chart
[lower right] This chart shows the hypothetical performance of buying & holding an asset [green line] and risk managing that same asset [blue line]. Note that when the model anticipates an increase in volatility it moves into cash. This can be seen as a flat horizontal line when the model has moved into cash.